Difference between revisions of "Spectrograms"
Martinwguy (talk | contribs) (→Get spectrograms of your music!) |
Martinwguy (talk | contribs) (→Inverse spectrograms) |
||
| (52 intermediate revisions by the same user not shown) | |||
| Line 1: | Line 1: | ||
[[Image:City Music - Spectrogram.jpg|800px]] | [[Image:City Music - Spectrogram.jpg|800px]] | ||
| − | Spectrograms are used in the WikiDelia to visualise the sonic content of Delia's | + | [[Spectrograms]] are used in the WikiDelia to visualise the sonic content of Delia's music. |
| − | In each | + | In each spectrogram, time runs from left to right, low frequencies are at the bottom and high ones at the top and the light at each point in the graph represents the energy in the sound at one frequency at a particular moment (or, rather, in one frequency band in a short sample taken around a particular moment.) |
As well as helping us understand the internal structure of Delia's pieces and her instruments and effects, these also help us recreate conventional scores from her sound files, for example: | As well as helping us understand the internal structure of Delia's pieces and her instruments and effects, these also help us recreate conventional scores from her sound files, for example: | ||
| Line 11: | Line 11: | ||
=Logarithmic frequency axis= | =Logarithmic frequency axis= | ||
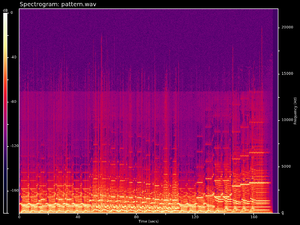
| − | The | + | [[Image:Sndfile-spectrogram analysis of The Pattern Emerges.png|thumb|right|The Pattern Emerges - Linear spectrogram from 0 to 22kHz of the whole piece (177 sec)]] |
| + | Most FFT-based spectrographic programs' output have a linear frequency axis, usually from 0Hz to 22050Hz for a CD-quality piece, in which the top half of the graph represents the top octave of the sound, the mostly inaudible 11025-22050Hz band, with all the musical detail crushed into the bottom rows of pixels. | ||
| + | |||
| + | [[Image:Sndfile-spectrogram analysis of The Pattern Emerges 8192x4096 cropped.png|thumb|right|The Pattern Emerges - linear spectrogram from 0 to 4kHz of the first 20s (the bottom left corner of the above)]] | ||
| + | Even if you zoom in on the interesting part of the spectrogram, the top half of the graph always represents the top octave of the visible frequency range. | ||
| + | |||
| + | {{Thumb|The Pattern Emerges - log spectrogram from 50Hz to 3600Hz of the first 20 seconds}} | ||
| + | What we would like is for each octave to be given the same height in the graph. | ||
| + | |||
| + | The spectrograms used in the WikiDelia are not the usual kind. Their vertical scale is logarithmic, which gives the same number of pixel rows per octave. | ||
| + | |||
| + | Not only does this give a graphic representation to music similar to conventional score notation for the notes and rhythms | ||
| + | but also give a characteristic graphical footprint of constant visual size to different notes of the same instrument (in a linear spectrogram, the harmonics of higher notes are more widely spread than those of lower notes.) | ||
=Usage in the WikiDelia= | =Usage in the WikiDelia= | ||
| − | The spectrogram of a piece goes in | + | The spectrogram of a piece goes in two places: |
* On the piece's page in a section '''Spectrogram''' usually just above '''Availability''' so that the Listen button is near. | * On the piece's page in a section '''Spectrogram''' usually just above '''Availability''' so that the Listen button is near. | ||
* Spectrograms of complete pieces are on the [[Audio]] page | * Spectrograms of complete pieces are on the [[Audio]] page | ||
| − | |||
For example the piece [[Air]] has [[:File:Air.ogg]] and [[:File:Air - Spectrogram.jpg]], used by the MediaWiki macros <TT><nowiki>{{Spectrogram|Air - Spectrogram}}</nowiki></TT> and <TT><nowiki>{{Spectrogallery|Air}}</nowiki></TT> | For example the piece [[Air]] has [[:File:Air.ogg]] and [[:File:Air - Spectrogram.jpg]], used by the MediaWiki macros <TT><nowiki>{{Spectrogram|Air - Spectrogram}}</nowiki></TT> and <TT><nowiki>{{Spectrogallery|Air}}</nowiki></TT> | ||
| + | |||
| + | =Software= | ||
| + | {{Thumb|Noah - Grayscale spectrogram by mkjpg}} | ||
| + | |||
| + | The WikiDelia's spectrum analyser, [https://gitlab.com/martinwguy/delia-derbyshire/tree/master/anal "mkjpg"], was written specifically for it using a modified version of [http://www.mega-nerd.com/libsndfile/tools/#spectrogram sndfile-spectrogram] to prepare a linear spectrogram which is then distorted by an ImageMagick script to give it a logarithmic frequency axis. | ||
| + | |||
| + | The program "Sox" can also be used to produce the linear spectrogram, but you need [https://sourceforge.net/u/martinwguy/sox this modified version] to remove the limits on output image size, to normalise the output's brightness, and to make it 250 times faster and not need 16GB of RAM. | ||
| + | |||
| + | {{Thumb|Noah - Grayscale spectrogram by logft}} | ||
| + | {{Thumb|Noah - Grayscale spectrogram by constant-q-cpp}} | ||
| + | |||
| + | An alternative technique would be to perform a Constant-Q tranform directly instead of distorting a linear spectrogram. Candidates are: | ||
| + | * Judith Brown's brute force algorithm, [http://gitlab.com/martinwguy/logft "logft"] from 1988-91. | ||
| + | * Brown and Puckett's efficient algorithm,<ref>[http://academics.wellesley.edu/Physics/brown/pubs/effalgV92P2698-P2701.pdf An efficient algorithm for the calculation of a constant Q transform] by Brown and Puckette.</ref><ref>[http://wwwmath.uni-muenster.de/logik/Personen/blankertz/constQ/constQ.html ''The Constant Q Transform''], an implementation in Matlab by Benjamin Blankertz</ref><ref>[http://sourceforge.net/p/sc3-plugins/code/ci/master/tree/source/PitchDetection/Qitch.cpp An earlier implementation in more C-like C++] in a pitch detection plugin for Supercollider, licensed under GPL.</ref> using a precomputed FFT temporal kernel (a what?) | ||
| + | * An optimized version of the above, "constant-q-cpp", doing octave decimation of the signal to save compute time.<ref>[http://iem.kug.ac.at/fileadmin/media/iem/projects/2010/smc10_schoerkhuber.pdf Constant-Q Transform Toolbox for Music Processing]: An optimization in MATLAB of Brown and Puckette's efficient Constant-Q algorithm.</ref><ref>[https://code.soundsoftware.ac.uk/projects/constant-q-cpp ''C++ Constant-Q''] at soundsoftware.co.uk, a C++ implementation of the above with permissive license.</ref> | ||
| + | |||
| + | The results with the implementations I have found have so far been disappointing: crisper at the top but lacking temporal detail in the lower frequency range. | ||
| + | |||
| + | Graphical programs that can directly display log-frequency-axis spectrograms are: | ||
| + | * the free audio editor [http://www.audacityteam.org Audacity], though the output is blockier than ours | ||
| + | * the free audio file viewer "[http://www.sonicvisualiser.org sonic-visualiser]", which also has a Constant-Q spectrogram VAMP plugin | ||
| + | * the latest release of [http://www.mega-nerd.com/libsndfile/tools/ sndfile-tools] (1.04 or later) includes a new <TT>--log-freq</TT> option to <TT>sndfile-spectrogram</TT> achieving the same effect as here. If your OS has an older version and you can compile C, you can [https://github.com/erikd/sndfile-tools get it on github]. | ||
=Get spectrograms of your music!= | =Get spectrograms of your music!= | ||
{{Thumb|Moogies Bloogies - Spectrogram with piano staff (detail)}} | {{Thumb|Moogies Bloogies - Spectrogram with piano staff (detail)}} | ||
I am happy to run the log spectrum analyser on your music. You can specify: | I am happy to run the log spectrum analyser on your music. You can specify: | ||
| − | * lowest pitch (usually | + | * lowest pitch (usually 27.5Hz) |
* number of octaves (usually 9, to 14080Hz) | * number of octaves (usually 9, to 14080Hz) | ||
* number of pixels per semitone on the frequency axis (usually 8) | * number of pixels per semitone on the frequency axis (usually 8) | ||
* number of pixel columns per second on the time axis (usually 50) | * number of pixel columns per second on the time axis (usually 50) | ||
| − | Optionally the software can superimpose single-pixel black and white lines at the frequencies of the piano keys and three-pixel-wide white lines at the positions of the manuscript | + | Optionally the software can superimpose single-pixel black and white lines at the frequencies of the piano keys and three-pixel-wide white lines at the positions of the manuscript staff lines, see the example on the right. |
If this interests you, please [[Donate|Make a small donation]] and email <TT>delia.derbyshire.net@gmail.com</TT> attaching the sound file you would like turned into a picture. | If this interests you, please [[Donate|Make a small donation]] and email <TT>delia.derbyshire.net@gmail.com</TT> attaching the sound file you would like turned into a picture. | ||
| − | + | Alternatively, if you can compile C for Linux, you can fetch [https://gitlab.com/martinwguy/spettro spettro from gitlab], which plays music files while showing a log spectrogram of it scrolling right to left with the current playing time at centre screen. | |
| − | |||
| − | |||
| − | |||
| − | |||
| − | |||
| − | |||
| − | |||
| − | |||
| − | |||
| − | |||
| − | |||
| − | |||
| − | |||
| − | |||
| − | |||
| − | [[ | + | =[[Inverse spectrograms]]= |
| − | + | There are a few reconversions of spectrograms of unpublished music back into rough audio, created by some [https://codeberg.org/martinwguy/anal even hairier custom software]: | |
| − | + | * ''[[Pot Au Feu early version]]'', to get an idea of the audio quality of the reconstructions | |
| − | + | * ''[[Singing Waters]]'', a rain-falling effect whose spectrogram resembles the layout of the poem it tells | |
| − | + | * ''[[Robert Lowell]]'', a 4-minute evolving soundscape, reconstructed from only 4 pixel columns per second | |
| − | + | * ''[[Random Together 1]]'', 2m30 of cacophony, not helped at all by the reconstruction! | |
| − | |||
| − | |||
| − | |||
| − | |||
| − | |||
| − | |||
| − | |||
| − | |||
| − | |||
| − | |||
=References= | =References= | ||
<references/> | <references/> | ||
| + | |||
| + | [[Category:Technology]] | ||
Latest revision as of 08:50, 21 September 2025
Spectrograms are used in the WikiDelia to visualise the sonic content of Delia's music.
In each spectrogram, time runs from left to right, low frequencies are at the bottom and high ones at the top and the light at each point in the graph represents the energy in the sound at one frequency at a particular moment (or, rather, in one frequency band in a short sample taken around a particular moment.)
As well as helping us understand the internal structure of Delia's pieces and her instruments and effects, these also help us recreate conventional scores from her sound files, for example:
Contents
Logarithmic frequency axis
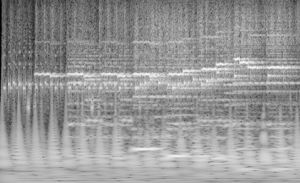
Most FFT-based spectrographic programs' output have a linear frequency axis, usually from 0Hz to 22050Hz for a CD-quality piece, in which the top half of the graph represents the top octave of the sound, the mostly inaudible 11025-22050Hz band, with all the musical detail crushed into the bottom rows of pixels.
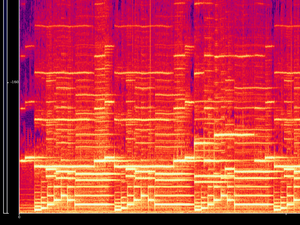
Even if you zoom in on the interesting part of the spectrogram, the top half of the graph always represents the top octave of the visible frequency range.
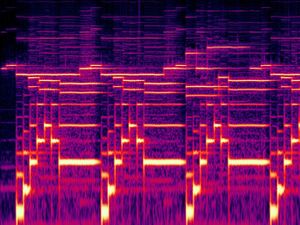
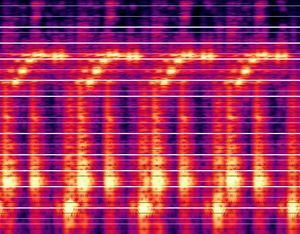
What we would like is for each octave to be given the same height in the graph.
The spectrograms used in the WikiDelia are not the usual kind. Their vertical scale is logarithmic, which gives the same number of pixel rows per octave.
Not only does this give a graphic representation to music similar to conventional score notation for the notes and rhythms but also give a characteristic graphical footprint of constant visual size to different notes of the same instrument (in a linear spectrogram, the harmonics of higher notes are more widely spread than those of lower notes.)
Usage in the WikiDelia
The spectrogram of a piece goes in two places:
- On the piece's page in a section Spectrogram usually just above Availability so that the Listen button is near.
- Spectrograms of complete pieces are on the Audio page
For example the piece Air has File:Air.ogg and File:Air - Spectrogram.jpg, used by the MediaWiki macros {{Spectrogram|Air - Spectrogram}} and {{Spectrogallery|Air}}
Software
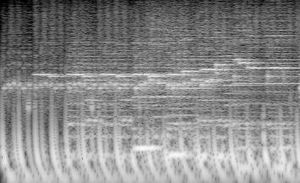
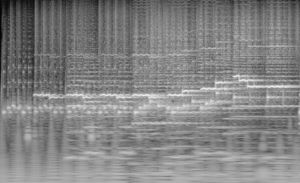
The WikiDelia's spectrum analyser, "mkjpg", was written specifically for it using a modified version of sndfile-spectrogram to prepare a linear spectrogram which is then distorted by an ImageMagick script to give it a logarithmic frequency axis.
The program "Sox" can also be used to produce the linear spectrogram, but you need this modified version to remove the limits on output image size, to normalise the output's brightness, and to make it 250 times faster and not need 16GB of RAM.
An alternative technique would be to perform a Constant-Q tranform directly instead of distorting a linear spectrogram. Candidates are:
- Judith Brown's brute force algorithm, "logft" from 1988-91.
- Brown and Puckett's efficient algorithm,[1][2][3] using a precomputed FFT temporal kernel (a what?)
- An optimized version of the above, "constant-q-cpp", doing octave decimation of the signal to save compute time.[4][5]
The results with the implementations I have found have so far been disappointing: crisper at the top but lacking temporal detail in the lower frequency range.
Graphical programs that can directly display log-frequency-axis spectrograms are:
- the free audio editor Audacity, though the output is blockier than ours
- the free audio file viewer "sonic-visualiser", which also has a Constant-Q spectrogram VAMP plugin
- the latest release of sndfile-tools (1.04 or later) includes a new --log-freq option to sndfile-spectrogram achieving the same effect as here. If your OS has an older version and you can compile C, you can get it on github.
Get spectrograms of your music!
I am happy to run the log spectrum analyser on your music. You can specify:
- lowest pitch (usually 27.5Hz)
- number of octaves (usually 9, to 14080Hz)
- number of pixels per semitone on the frequency axis (usually 8)
- number of pixel columns per second on the time axis (usually 50)
Optionally the software can superimpose single-pixel black and white lines at the frequencies of the piano keys and three-pixel-wide white lines at the positions of the manuscript staff lines, see the example on the right.
If this interests you, please Make a small donation and email delia.derbyshire.net@gmail.com attaching the sound file you would like turned into a picture.
Alternatively, if you can compile C for Linux, you can fetch spettro from gitlab, which plays music files while showing a log spectrogram of it scrolling right to left with the current playing time at centre screen.
Inverse spectrograms
There are a few reconversions of spectrograms of unpublished music back into rough audio, created by some even hairier custom software:
- Pot Au Feu early version, to get an idea of the audio quality of the reconstructions
- Singing Waters, a rain-falling effect whose spectrogram resembles the layout of the poem it tells
- Robert Lowell, a 4-minute evolving soundscape, reconstructed from only 4 pixel columns per second
- Random Together 1, 2m30 of cacophony, not helped at all by the reconstruction!
References
- ↑ An efficient algorithm for the calculation of a constant Q transform by Brown and Puckette.
- ↑ The Constant Q Transform, an implementation in Matlab by Benjamin Blankertz
- ↑ An earlier implementation in more C-like C++ in a pitch detection plugin for Supercollider, licensed under GPL.
- ↑ Constant-Q Transform Toolbox for Music Processing: An optimization in MATLAB of Brown and Puckette's efficient Constant-Q algorithm.
- ↑ C++ Constant-Q at soundsoftware.co.uk, a C++ implementation of the above with permissive license.

